Why Desmos Training Is Now a Core Part of SAT Preparation

Desmos is no longer just an optional calculator—it has become an essential part of Digital SAT preparation. In this post, we'll explore how Desmos works on the Digital SAT and share practical tips for using it efficiently on test day.
What Is Desmos?
Desmos is an advanced online graphing calculator that is built directly into the Digital PSAT and SAT testing platform. Unlike a traditional handheld calculator, Desmos allows students to graph equations, create tables, analyze functions, and visualize mathematical relationships in real time.
Because it is integrated into the Bluebook testing application, students can access Desmos throughout the entire Math section without needing any additional software or equipment.
Importance in the Collegeboard Exams
Since the PSAT and SAT transitioned to digital testing in 2023 and 2024, Desmos has become an essential tool for students preparing for College Board exams. Many students spend hours studying content, but receive little instruction on how to use the calculator built directly into the testing platform.
Here is a glimpse of what this math tool looks like in the SAT & PSAT Exams.
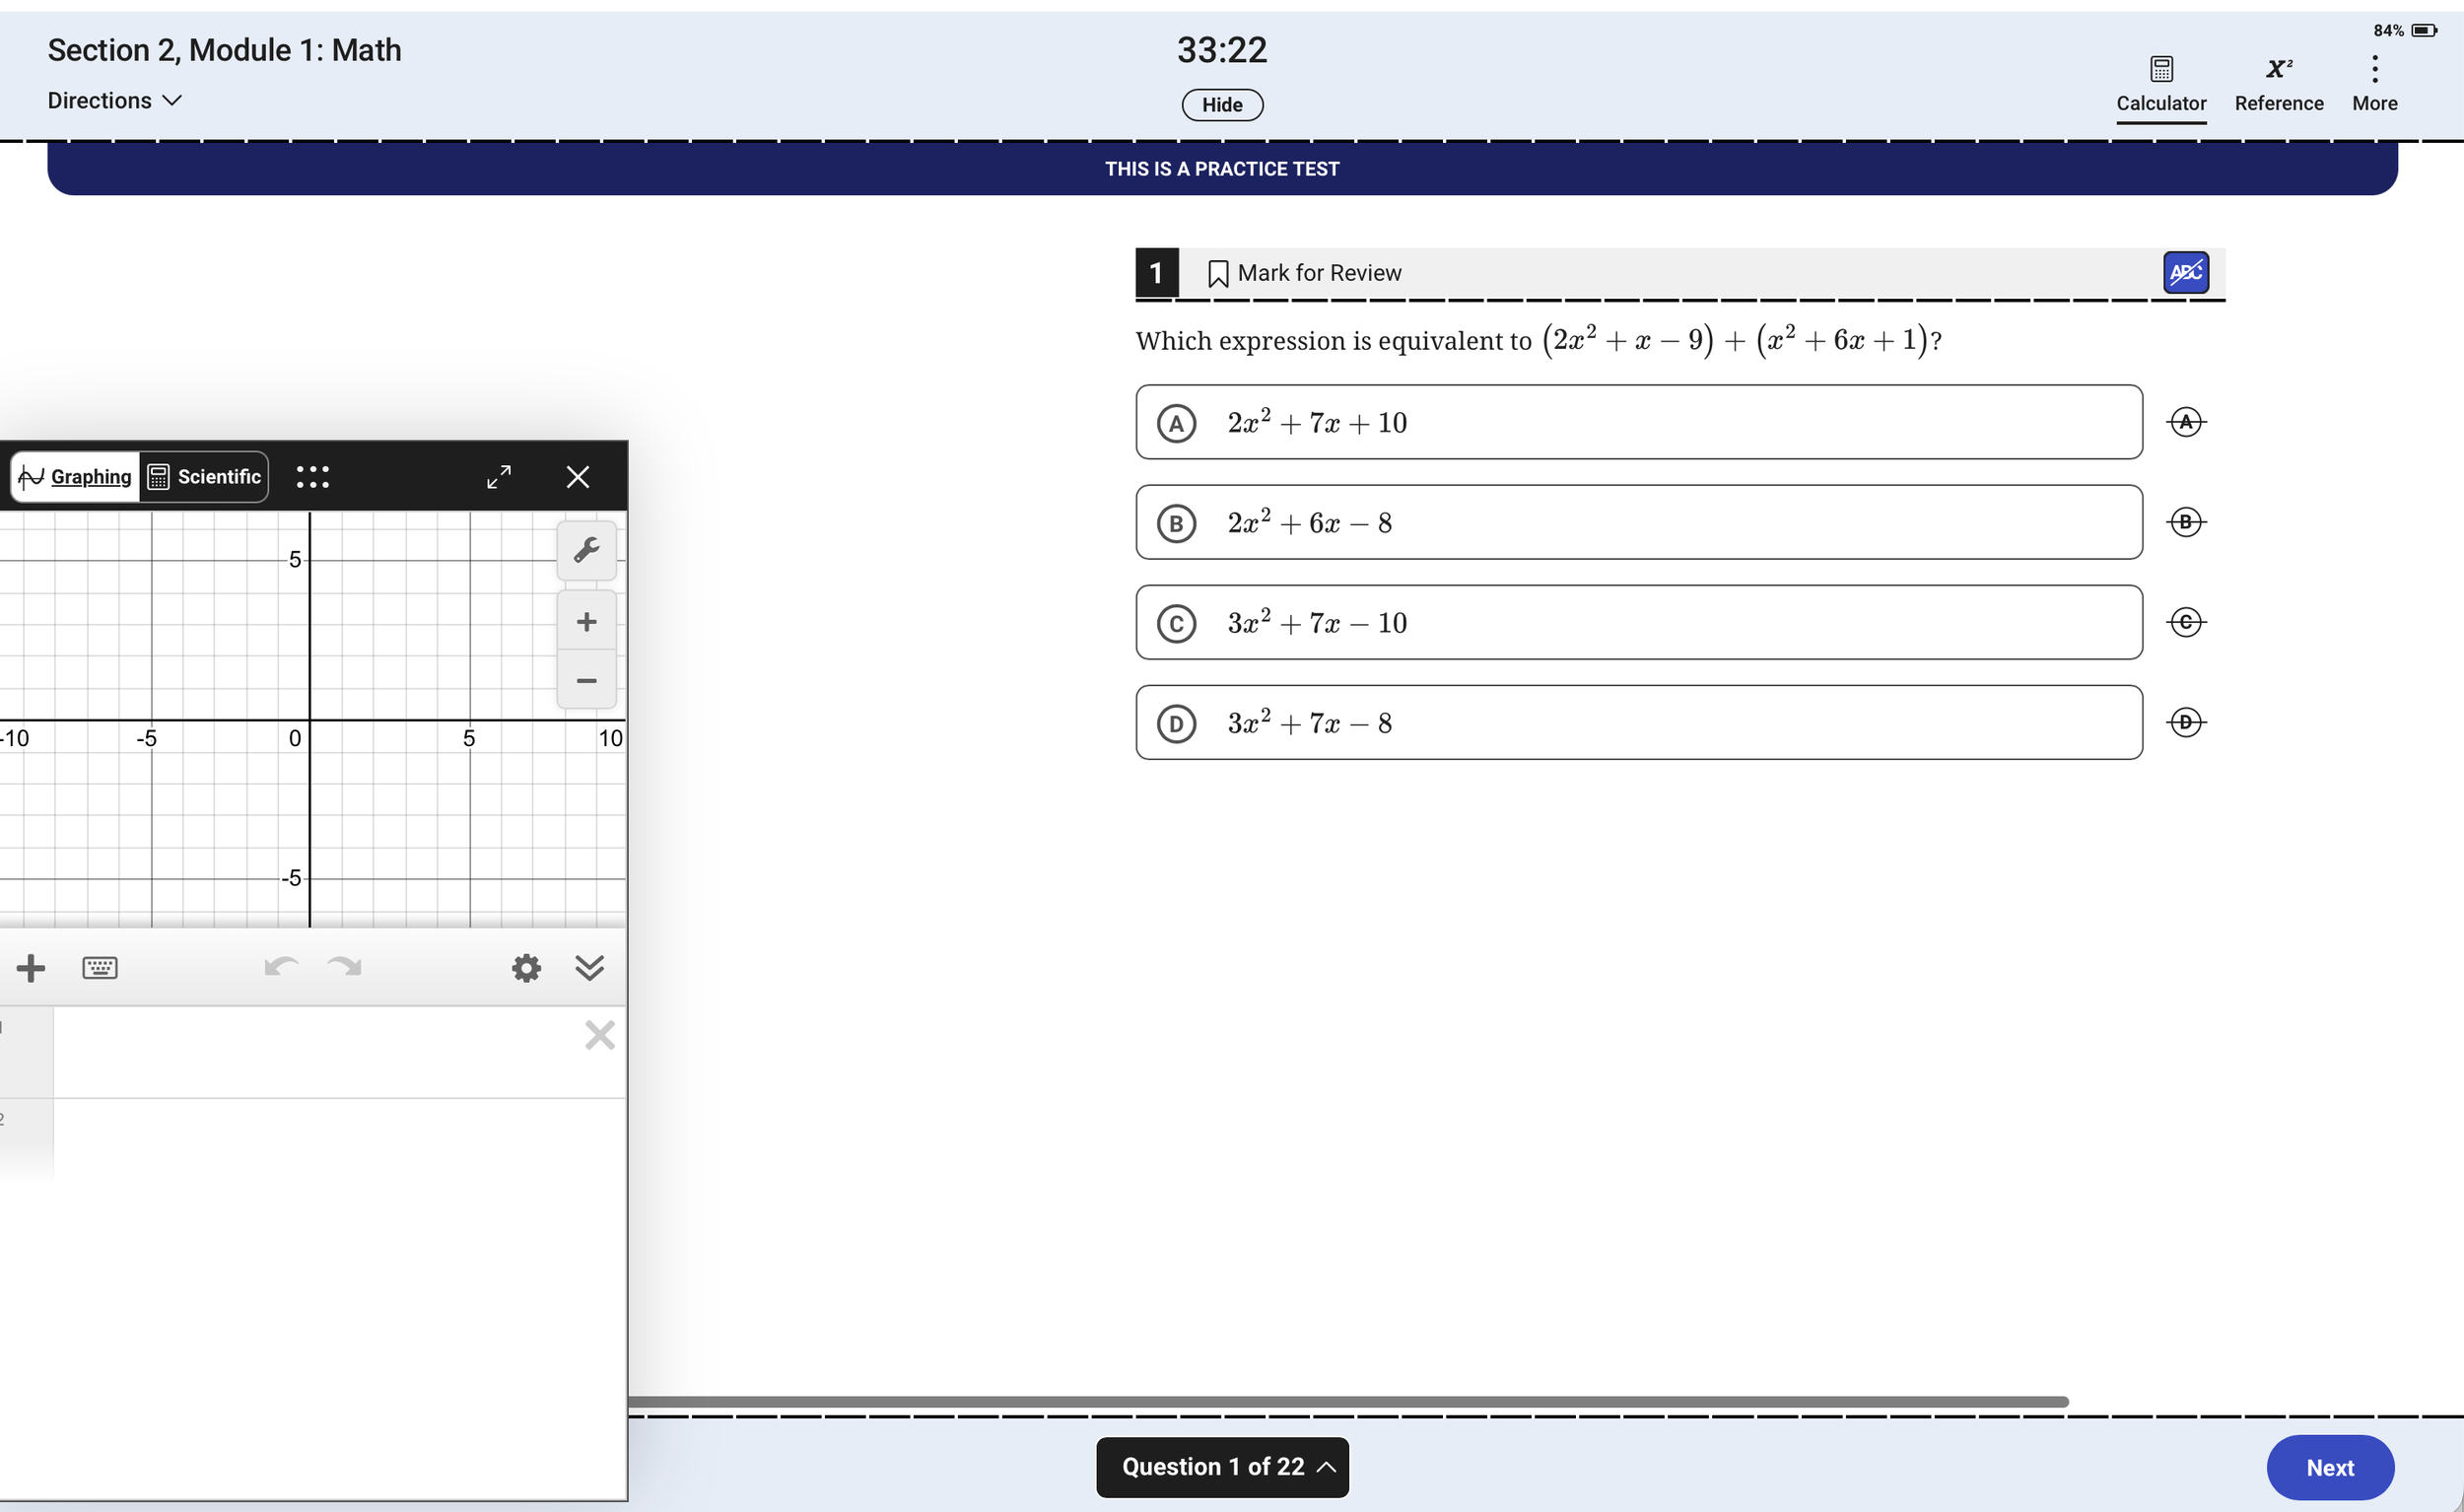
Pop-up box on the left shows Graphing Desmos tool. Bluebook allows student to switch to Scientific & Graphing versions.
Common Uses of Desmos on the SAT
Graphing Functions and Equations
One of the most common uses of Desmos is graphing equations. Instead of solving every problem algebraically, students can often graph a function and analyze its behavior visually. This can be particularly helpful when working with linear equations, quadratics, and exponential functions.
Checking Answers
Even when students solve a problem using traditional methods, Desmos can be used to verify the answer. A quick graph or table can help confirm whether a solution makes sense before moving on to the next question.
Using Tables to Identify Patterns
The table feature allows students to quickly observe relationships between variables. This can be useful for questions involving functions, rates of change, and numerical patterns where visualizing values may be easier than performing lengthy calculations.
Finding X-Intercepts and Y-Intercepts
Many SAT questions involve identifying where a graph crosses the x-axis or y-axis. Desmos can display these points directly, helping students solve certain problems more efficiently.
Understanding Transformations
Students can use Desmos to visualize how graphs change when equations are shifted, stretched, reflected, or compressed. This can make abstract concepts easier to understand and apply on test day.
Comparing Multiple Functions
Desmos makes it easy to graph several functions simultaneously. Students can compare graphs, identify similarities and differences, and analyze how changing parameters affects the shape of a function.
Desmos Features Many Students Don't Know About
Perhaps the biggest misconception is that Desmos is only a calculator. In reality, many high-scoring students use it as a visualization tool, a formula replacement, and in some cases, a time saving tool.
Using Desmos to Find Distance Between Two Points
Traditionally, students learn the Distance Formula:
d = √[(x₂ − x₁)² + (y₂ − y₁)²]
While students should still understand the underlying concept, students can save time by entering two points directly into Desmos.
Type “distance” and in the wide parentheses, type in the two coordinates. Make sure the coordinates are in their own parenthesis and separate with a comma!
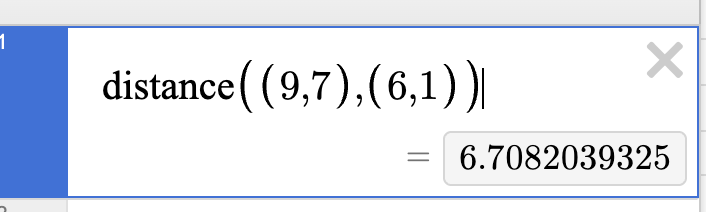
You can simply type “distance” and put your two points with a comma.
Using the Slider Tool
Some SAT questions ask students to understand how changing a number in an equation affects the graph.
The graph y = 5x^2 + 3x - k passes through the point (0.53, 0). What is the value of k?
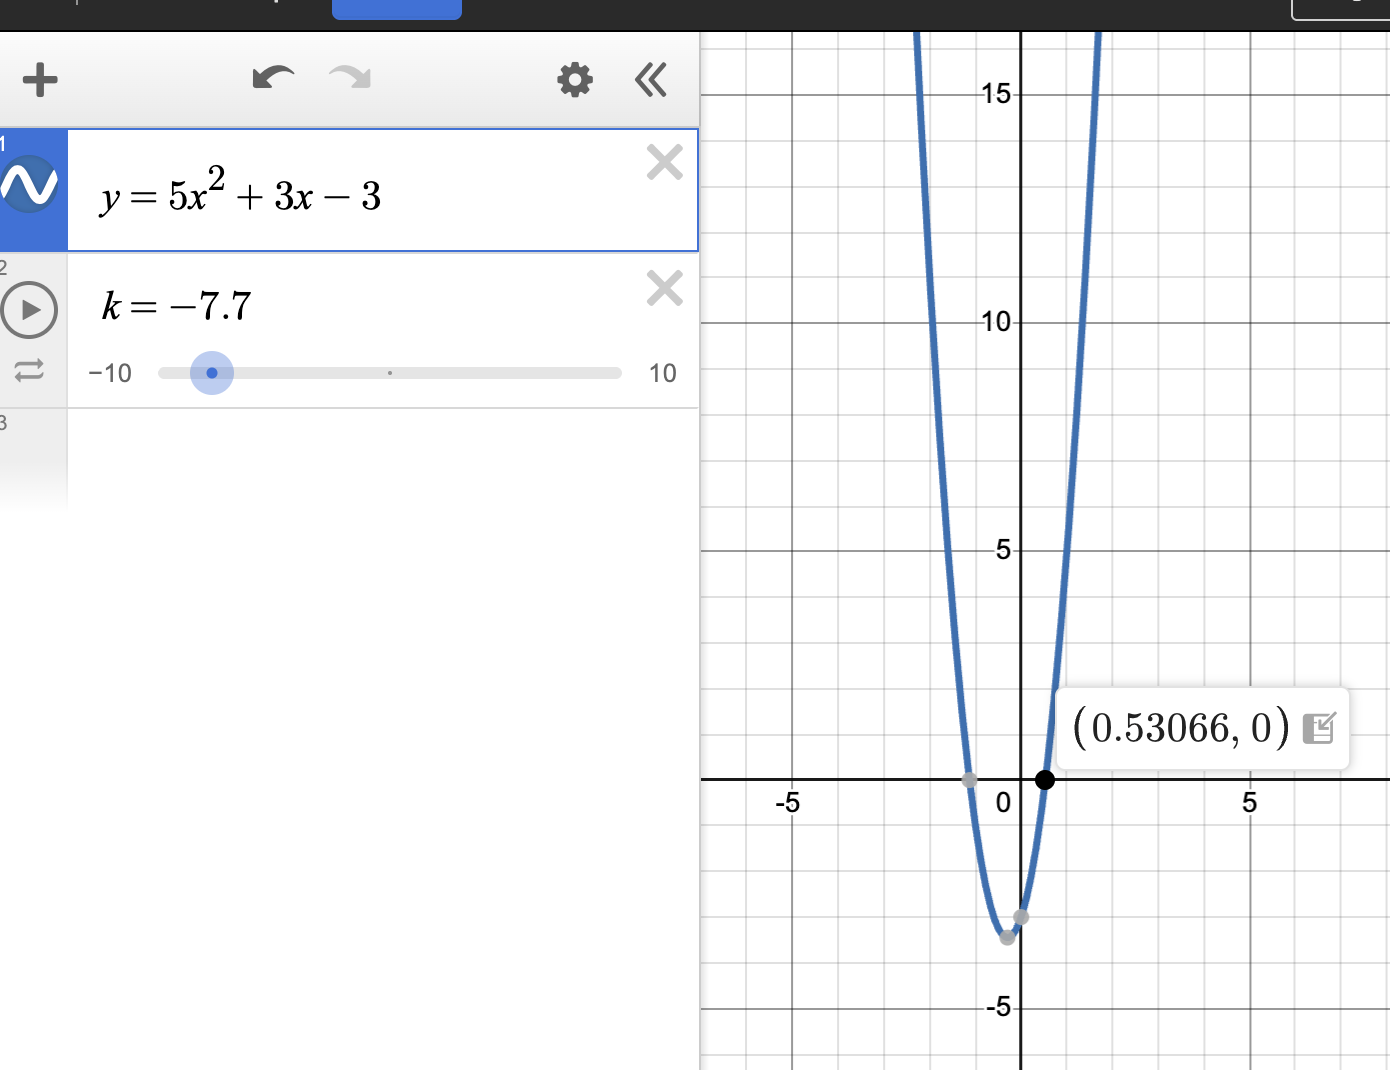
Desmos will create a slider for k. Students can then move the slider until the graph passes through the point (0.53066,0).
Let Desmos Do the Statistics!
Students can find the mean and median without spending time working out the math.
You can type mean() and median(), and insert numbers in any order in the parentheses for Desmos.
Using the Table Feature to Test Values
While many students use Desmos only for graphing, the table feature can be equally useful. It allows students to quickly generate values as well as forming different equations.
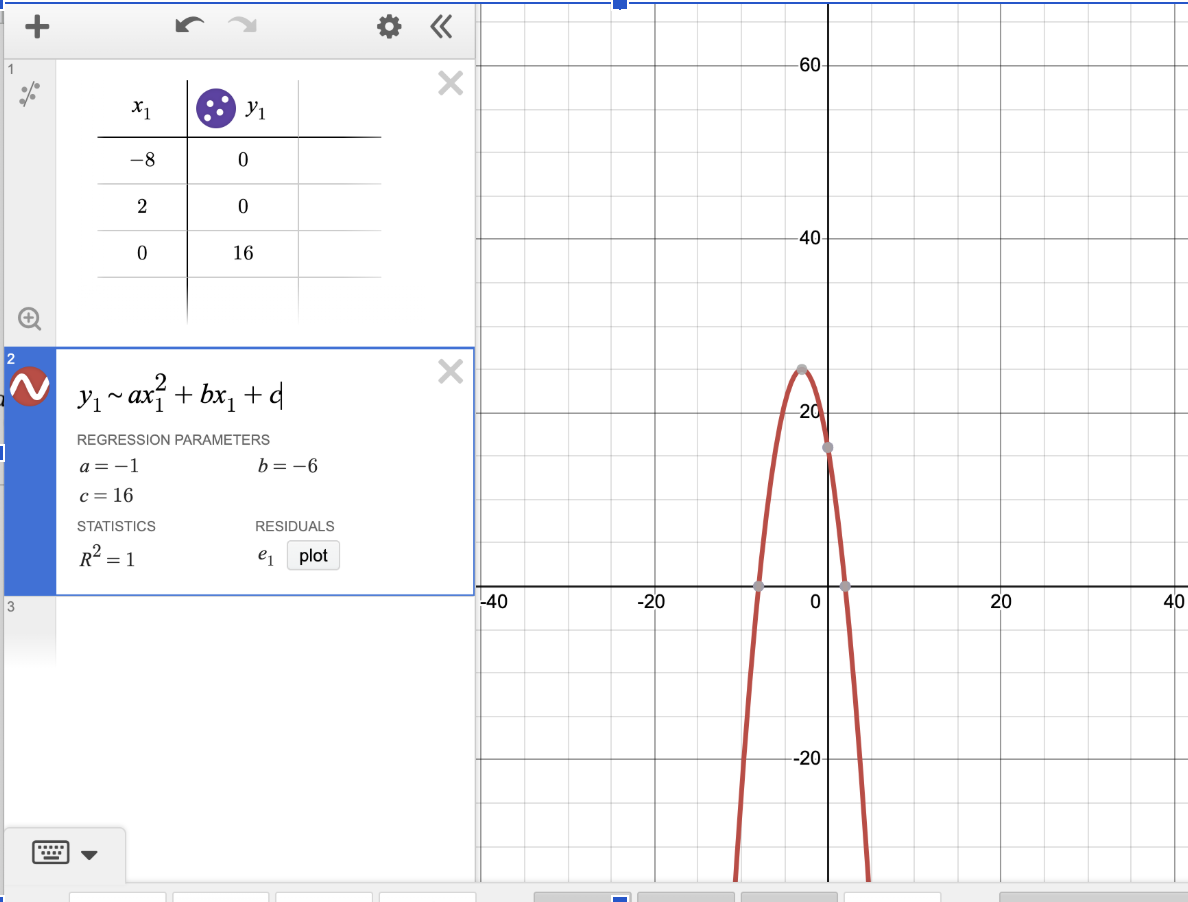
With three or more coordinates, table becomes an extremely useful for forming equations and finding values for parts of an equation.
Final Thoughts
When used strategically, Desmos can help answer exam questions with shortcuts and reduce errors. By combining strong content knowledge with effective Desmos skills, students can approach the Digital PSAT and SAT with greater efficiency and confidence.
Like any test-taking tool, Desmos is most effective when practiced before exam day. The earlier students become familiar with its features, the better prepared they will be to take advantage of them when it matters most.
Interested in SAT or PSAT Preparation?
Learn more about individualized SAT and PSAT programs or schedule a consultation to discuss your student's goals.
About the Author
Kim is the founder and lead instructor of MetaPrep. A University of Virginia graduate with over 10 years of instruction experience, she specializes in Digital SAT and PSAT preparation, focusing on strategic problem-solving, pattern recognition, and individualized student support.